The Ignite UI Data Chart is a chart control that uses the Canvas tag in HTML5 to plot different kinds of chart into web applications and pages. The control has numerous series which can be combined and this way you can create even more series such as…
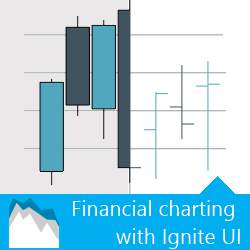
Or should I say “How to deliver charts for Technical analysis” and then throw in a little bit of understanding for a good measure. So, we are technical people, no? Then technical analysis shouldn’t sound so distant? Yeah, well, in the field of…