Windows Forms Bullet Graph
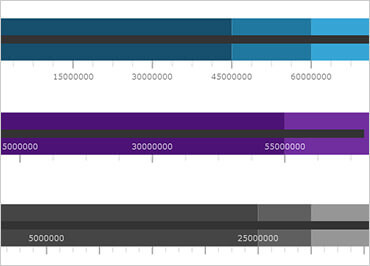
Create attractive data presentations with the Bullet Graph control, replacing meters and gauges with clear, simple, straightforward graphs. The Bullet Graph is one of the most effective and efficient ways to present progress towards goals, good/better/best ranges, or multiple measurement comparisons in a compact horizontal or vertical space.
Learn More
Windows Forms Gauge Controls
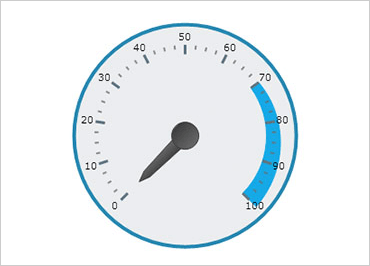
Power your data visualization needs with Windows Forms gauge controls that can play a crucial role on dashboards, business scorecards, and reports. Create round radial, graduated linear, LED-style digital, or hybrid gauges that combine one or more styles, scales, and needles.
Learn More
Windows Forms Linear Gauge
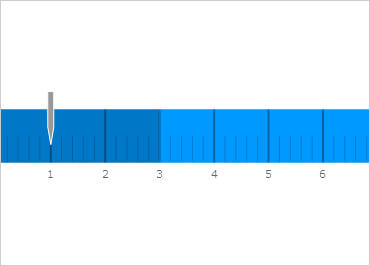
The Windows Forms Linear Gauge enables you to visualize where a specific point sits on one or more defined ranges. It also works as an input component, allowing users to place the needle anywhere along the continuum and update application data.
Learn More