Hello,I am trying to add simple example of igx-data-chart in my Angular part of Electron app as shown here:https://www.infragistics.com/products/ignite-ui-angular/angular/components/charts/chart-overview#angular-bar-chart and the chart is not showing at…
I am currently using AG 12.3 and IG 12.3.
I am asking this as a follow-up to AG Composite Chart.
I was successfully able to create the 4 charts I needed, all in the same (exposing) component thanks to the response which included this sample: 8132.DynamicStackedChart…
Hi.I am using a data chart in Ignite UI for Angular. For my project it is necessary to zoom, but only by clicking the mouse. Is it possible to disable only the zoom via the mouse wheel, keeping the zoom by click functionality?Thanks
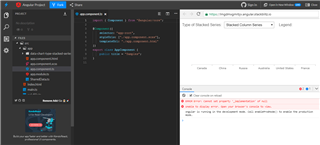
The StackBlitz link for Stacked Series in Data Chart does not work.
I've narrowed done the error due to this line of code in the component.ts file
Thanks to everyone who attended our Infragistics Ultimate 17.1 webinar. We’re very excited about all the great new features and updates in this new release and we hope you are as well. Please don’t forget to download a demo of Infragistics…
We recently held a webinar for the India/APAC region about how to build your first Angular 4 application.
Watch the video recap on YouTube here!
A powerful framework for both mobile and desktop development, Angular is one of the most popular JavaScript…